05-May-2013
Bucks CC Election Results
What effect did HS2 have ?
After the election on 2nd May, the overall results were
| Party | Seats | % of vote |
|---|---|---|
| Conservative | 36 | 41.0% |
| UK Independence Party | 6 | 27.0% |
| Liberal Democrat | 5 | 14.9% |
| Labour | 1 | 11.5% |
| Independent | 1 | 3.8% |
UKIP won 6 seats, all on or close to the proposed HS2 line. How did the pattern of voting vary according to proximity to the rail line ?
Analysis
The 49 electoral divisions were divided into 4 categories -
- 8 Divisions through which the line passes ( on the surface )
- 6 Divisions adjacent to these
- 5 Divisions over the (half) Chilterns tunnel
- All 30 other divisions
There are significant differences in the electoral composition of these categories - for example, Gerrards Cross & the Chalfonts are above the tunnel, while several of the Aylesbury divisions are adjacent to the line.
The votes cast for each party ( as a percentage of the total electorate ) are shown in this figure. The total votes cast for each party in the 4 categories divide up as shown here -
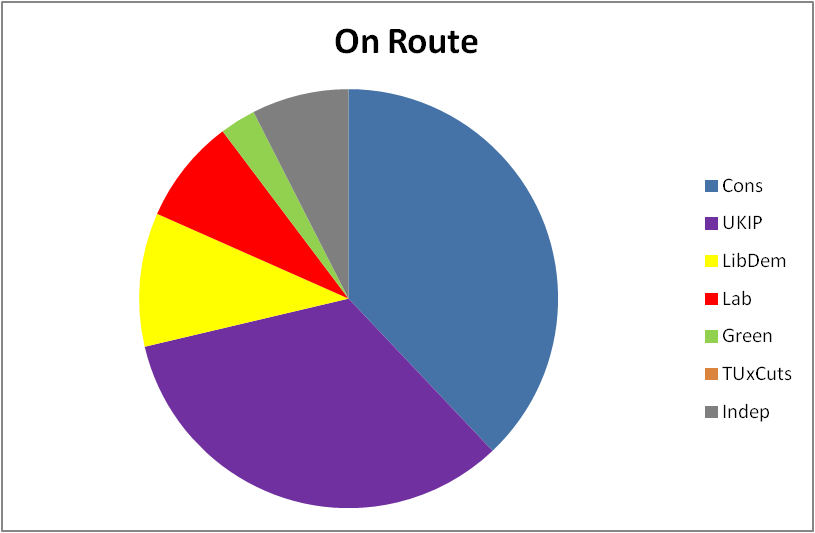
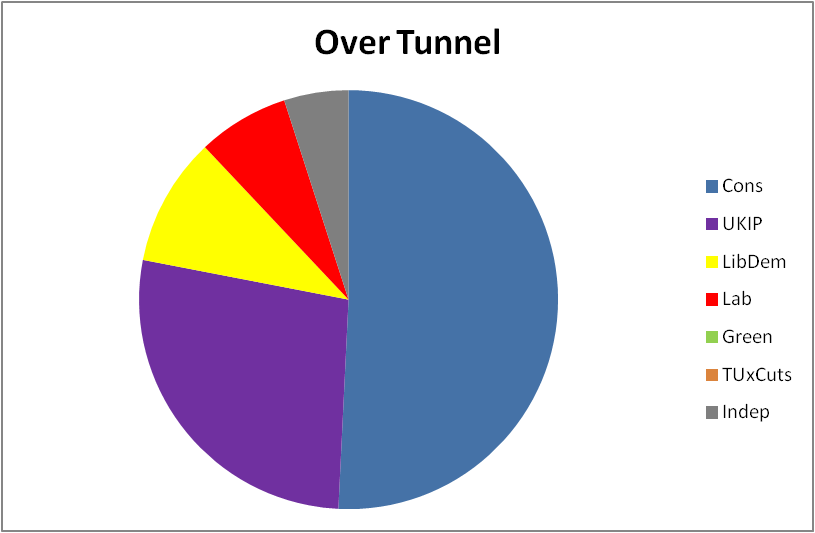
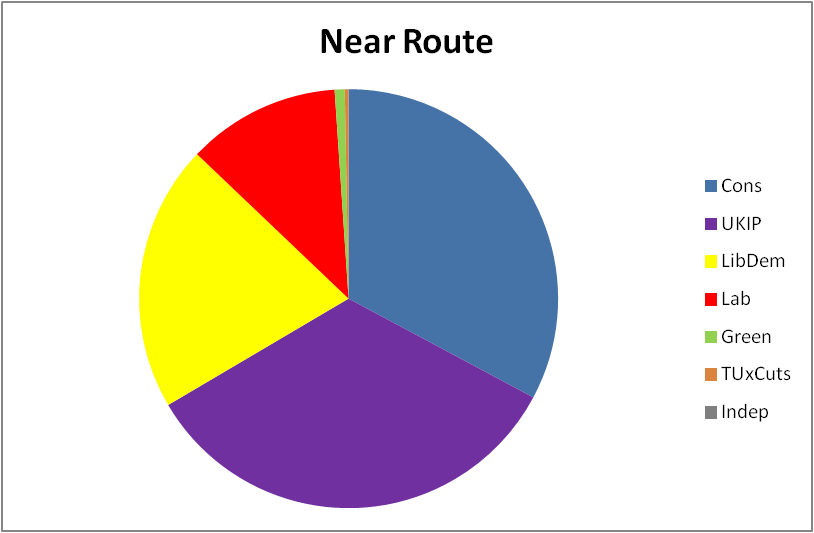
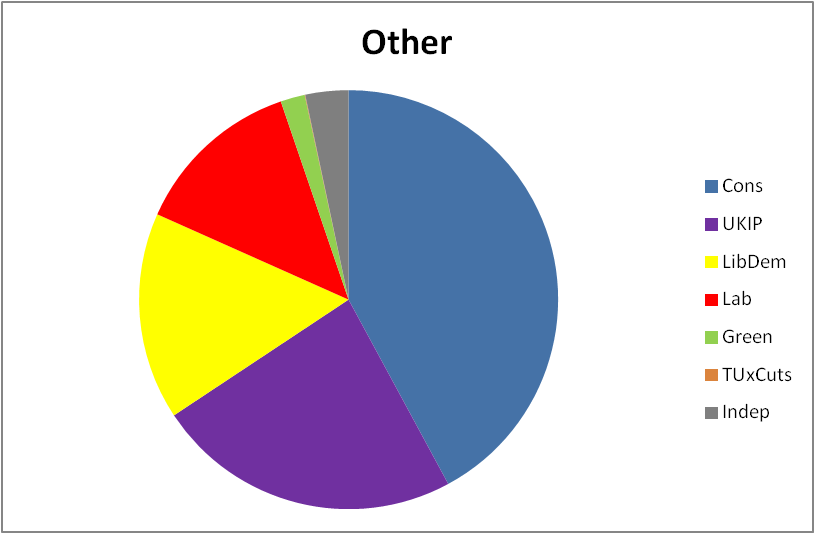
The percentage of the electorate voting for UKIP and the Conservatives was
| On | Near | Over | Other | |
|---|---|---|---|---|
| Conservative | 12.8 | 9.4 | 15.2 | 12.4 |
| UKIP | 11.3 | 9.7 | 8.2 | 7.0 |
showing an increase in the UKIP vote of 3 to 5% of the electorate in divisions on or near the line ( or 10 to 15% of votes cast, given the average turnout of around 30% ).
A comparison with the results of the previous election is not easy, due to boundary changes.